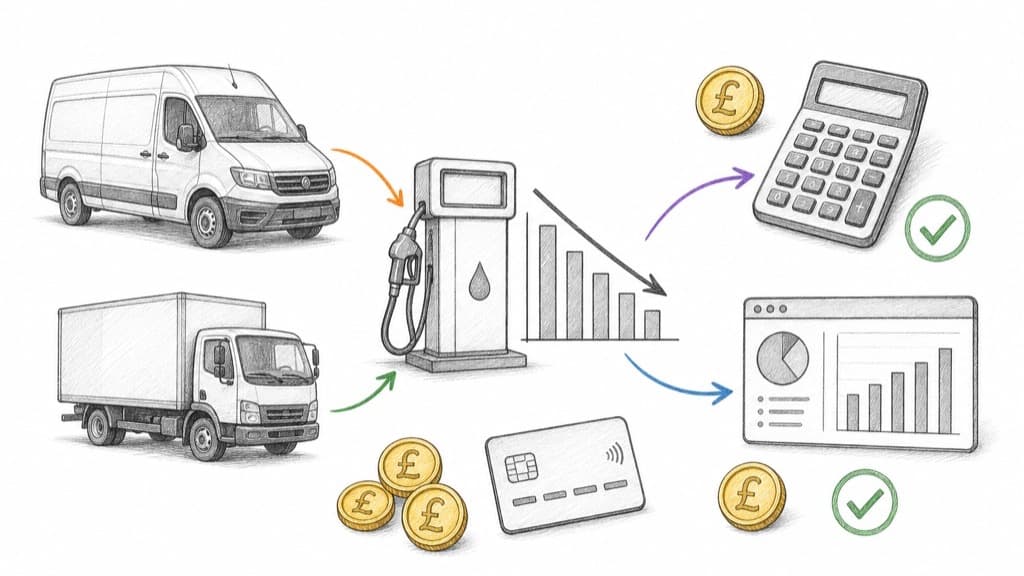
Fuel is the largest controllable cost for most fleets — typically 25–35% of total operating spend for vans and even more for HGVs. Yet most fuel-saving advice stops at "check tyre pressures and drive smoother", which moves the needle by low single digits at best.
The bigger savings sit in how your fleet buys fuel: which stations drivers can use, what fees you pay on top of the pump price, how much spend leaks to fraud and errors, and how many hours your team burns reconciling it all.
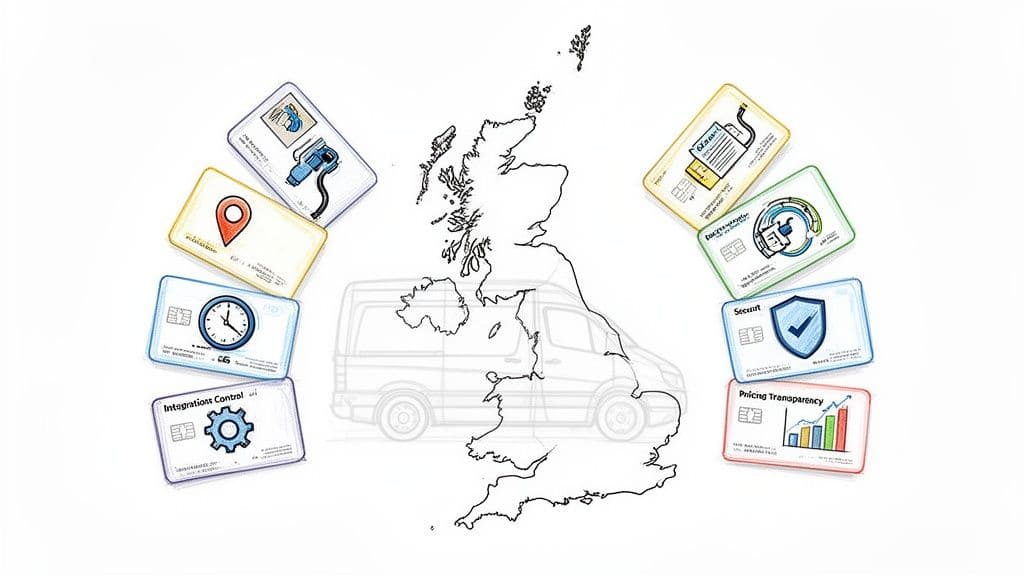
This guide ranks nine levers by realistic impact. For each one we give a conservative, an average and a cutting-edge case rather than a single optimistic promise — the same honest ranges we use in our free fleet fuel cost and savings calculator, where you can model all nine against your own fleet's numbers.
First, know your baseline
You cannot manage what you have not measured. Annual fleet fuel cost follows one formula:
Annual fuel cost = (annual miles ÷ MPG) × 4.54609 × price per litre, summed across vehicles. In metric units: annual kilometres ÷ 100 × L/100km × price per litre.
A worked example: a 20-vehicle fleet driving 20,000 miles each at 32 MPG pays about £80,000 a year with petrol at £1.40 per litre. Cost per mile is just as useful for benchmarking: pence per litre ÷ MPG × 4.54609 — around 19.9p per mile in that example.
Once you know your baseline and cost per mile, every lever below becomes measurable.
The 9 levers, ranked by impact
1. Pay the pump price, not the network price
The single biggest lever is where your fleet is allowed to buy fuel. Closed-network fuel cards route drivers to a fixed station list, often at a provider-set list price rather than the cheapest local pump price. An open-loop card lets drivers fill up wherever fuel is cheapest — supermarket forecourts included, which in the UK are routinely 5–10p per litre below motorway and branded stations.
Realistic impact: 3% (conservative) to 8% (cutting-edge) of total fuel spend. Rally customers save more than 5% on fuel on average with the free-market approach; our data analysis of free-market fuel buying breaks down where those savings come from.
2. Strip out service and transaction fees
Traditional fuel-card contracts accumulate line items that never appear in the headline offer: network fees, transaction fees, card fees, "account management" charges. At £5–10 per vehicle per month, a 50-vehicle fleet quietly pays £3,000–6,000 a year before buying a single litre.
Realistic impact: 75–100% of current fees removed, depending on what your replacement provider charges. The honest comparison is total cost of ownership — pump savings minus any subscription — not the fee line alone. Our fuel card comparison shows how the maths works across providers.
3. Stop fuel fraud and misuse before it happens
Industry estimates put fleet fuel fraud and misuse at 1–5% of fuel spend: personal fill-ups on the company card, skimmed card details, inflated receipts, fuel siphoned into second vehicles. Most of it goes unnoticed because reconciliation happens weeks after the transaction.
Real-time transaction visibility, per-card limits, and instant blocking change the economics. You will not prevent every incident, so plan on 25% of leakage prevented in a conservative case, 50% on average, and 75% with tight controls — not the 100% some vendors imply.
4. Kill the detour to "approved" stations
Every mile a driver detours to reach an in-network station costs fuel and paid working time. Eight extra miles per vehicle per week sounds trivial; across 25 vehicles it is over 10,000 wasted miles a year plus roughly 250 driver-hours sitting in traffic to reach a specific brand of forecourt.
Wider acceptance shrinks that detour to near zero. Realistic impact: 40–85% of detour miles eliminated, with the driver time recovered often worth more than the fuel itself.
5. Tighten spending controls — but count the savings honestly
Purchase limits, category blocks (no premium fuel, no in-store spend), and driver feedback loops can genuinely change buying behaviour. But this lever overlaps with fraud prevention and cheaper-fuel routing, so counting it separately risks double-counting the same pound twice.
Our advice, and the default in our calculator: treat behaviour change as an optional 0.5–3% on top, and only include it if you are actually going to enforce the controls.
6. Automate fuel admin and reporting
A finance team managing fuel across spreadsheets, provider portals and paper receipts typically spends several hours a week on exports, invoice matching and month-end reconciliation. One consolidated fuel ledger with automated receipt capture removes most of that work.
Realistic impact: 25–70% of fuel-admin hours recovered. This is productivity value rather than direct cash — it only becomes money when the team redeploys those hours — which is why serious savings models report it separately instead of hiding it inside one big number.
7. Clean up accounting errors at the source
Around 1–3% of fuel transactions need manual correction: missing receipts, miscoded categories, VAT reclaim errors. At £20–30 of finance time per correction, a 50-vehicle fleet doing 12 transactions per vehicle per month generates thousands of pounds of pure rework every year.
Automated receipt matching and coding prevents 50–90% of corrections depending on how much of the flow you automate. The VAT angle matters too — clean records mean fewer missed reclaims; see our guide to company car fuel benefit and VAT on fuel cards.
8. Go digital-first on cards
Physical card logistics are a hidden tax: new starters wait days for a card to arrive, replacements for lost or damaged cards leave vehicles unable to fuel, and shared cards break your per-driver data. Digital issuance with Apple Pay support means a new driver can fuel up minutes after onboarding.
Realistic impact: 50–100% of card-wait days eliminated. Small per incident, but it compounds across driver churn and card losses — and the data quality improvement feeds every other lever.
9. Track cost per mile monthly
The cheapest lever is a habit. Fleets that review cost per mile (or per kilometre) monthly catch problems while they are small: a vehicle whose consumption jumped 15%, a driver consistently filling at the most expensive station on the route, a fuel type mix drifting in the wrong direction.
Set a baseline, review monthly, investigate outliers. The fleets that treat fuel as a managed metric rather than an uncontrollable cost are the ones that keep the savings from levers one to eight.
What this adds up to
| Lever | Conservative | Average | Cutting-edge |
|---|
| Cheaper open-loop fuel | 3% of fuel spend | 5.5% | 8% |
| Service fees removed | 75% of fees | 90% | 100% |
| Detour miles eliminated | 40% | 65% | 85% |
| Fraud and misuse prevented | 25% of leakage | 50% | 75% |
| Behaviour change (optional) | 0.5% of fuel spend | 1.5% | 3% |
| Admin hours recovered | 25% | 50% | 70% |
| Accounting errors prevented | 50% | 75% | 90% |
| Card-wait days avoided | 50% | 80% | 100% |
For a typical 25-vehicle fleet, the direct cash levers alone usually land between 6% and 12% of annual fuel spend after subtracting the cost of the platform doing the work — before counting any recovered admin or driver time.
Rather than take our word for the ranges, put your own numbers in: the fleet fuel cost and savings calculator models every lever above across all three scenarios, shows the full formula, and deducts Rally's illustrative subscription so the result is a net figure, not a sales pitch.
Frequently asked questions
What is the fastest way to reduce fleet fuel costs? Switch how you buy fuel. Moving from a closed network to open-loop purchasing changes the price of every litre from day one, with no driver training or behaviour change required. Everything else compounds on top.
How much should a fleet expect to save overall? Be suspicious of single-number promises. Across the direct cash levers, 6–12% of annual fuel spend net of platform costs is a realistic range for most fleets; the exact figure depends on your current fees, routes, and how much leakage you have today.
Do fuel-efficient driving programmes work? Yes, but modestly and only while enforced — which is why we model behaviour change at 0.5–3% and keep it off by default. Structural levers (price, fees, fraud, detours) do not depend on sustained driver discipline.
Where do I start? Calculate your baseline annual fuel cost and cost per mile, then model the levers against your own fleet in the free calculator. If the numbers look worth pursuing, see how Rally's fuel cards implement levers one to eight, or explore the wider fleet management platform.